Lesson content
Read, practise, then check your understanding
Reports turn item history into planning evidence. Burndown shows remaining sprint work; velocity shows completed estimates across sprints; cumulative flow shows work distribution and bottlenecks. Dashboards combine filter-based gadgets for a specific audience.
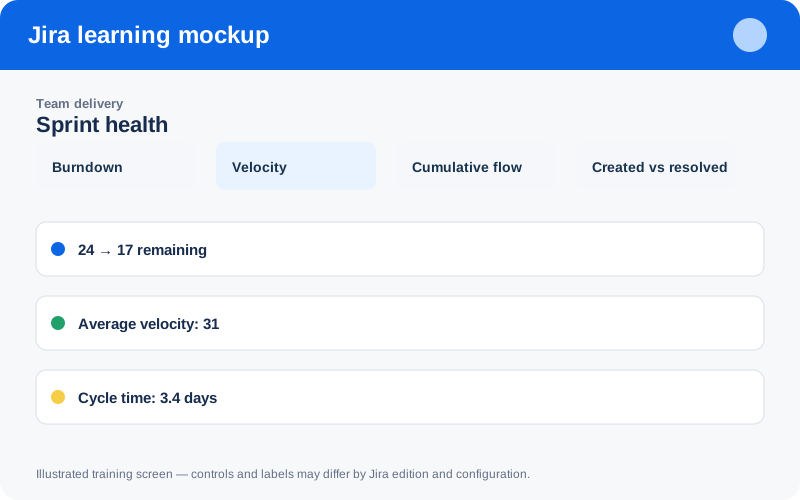
Illustrated training screen. Jira labels and controls can differ between Cloud, Data Center, company-managed, and team-managed projects.
Step-by-step
- Choose a decision and audience before selecting a metric.
- Verify estimates, status mapping, resolutions, and sprint history are reliable.
- Interpret trends across several periods rather than one data point.
- Create saved filters with clear owners and permission scope.
- Build a concise dashboard and review whether each gadget prompts action.
Worked example
Example: widening In Review on a cumulative flow diagram suggests a review bottleneck. Do not compare team velocity as a productivity ranking; estimation scales and contexts differ.
Practice task
Recreate the example in a sandbox project, record what you changed, and explain which team decision the configuration supports. Never experiment with production permissions, workflows, or automation without an approved change plan.
Knowledge check
Answer every question correctly to complete this chapter.
0 of 10 checks passed
Your progress is saved on this device.